The Grades & Placement Of College Students!

Anyone who has ever been through the process of applying to college knows how stressful this time period can become. From the anxiety of waiting on the school of your dreams to answer on your admission or, to freaking out about choices you are unsure about. This process can hold a weight on you without even knowing it. The college process is definetly not an easy one. Now, we begin to think about the what gets us in these universities. Is it our work ethic, how much education knowledge we have, is there a placement test? All of these things can factor whether your likely to get into a school or not.
Abstract
I was quite interested in the topic of school. My little brother is almost at that age where he is going to go through the college process. With observing the data, I was quite curious to see how they determined if a student were ready to get a job or not. So, I began to ask myself, what factors influence a students success in this dataset. When I began coding, I wanted to first find the results of Males and Females. Men were the dominant force in this data. Next, I wanted to see any correlation between the salary and grade percentages. Like what would help increase my salary and how much of school would I need? After finding this, I wanted to see what helped influence the degree type a student would like to have. I ran an importance graph to explore that finding. The results show that a students grades influence whether they will land a job or not. Grades throughout the years have impacted students in a positive or negative way.
Data Evaluation
I found my data off the website Kaggle. In this dataset, there was 215 observations and 15 columns, we use all of the columns to evaluate a student’s education history and to see if they are on track to completing their masters and landing a job. The observations were a little low if you ask me. First I wanted to look at how gender compares to all of the columns. Here is my github link.
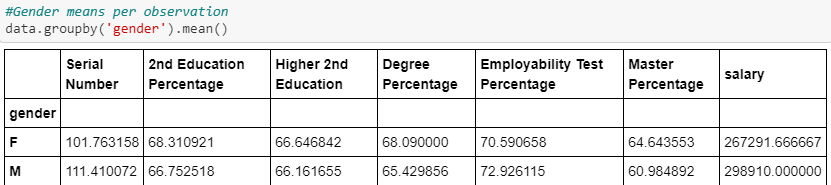
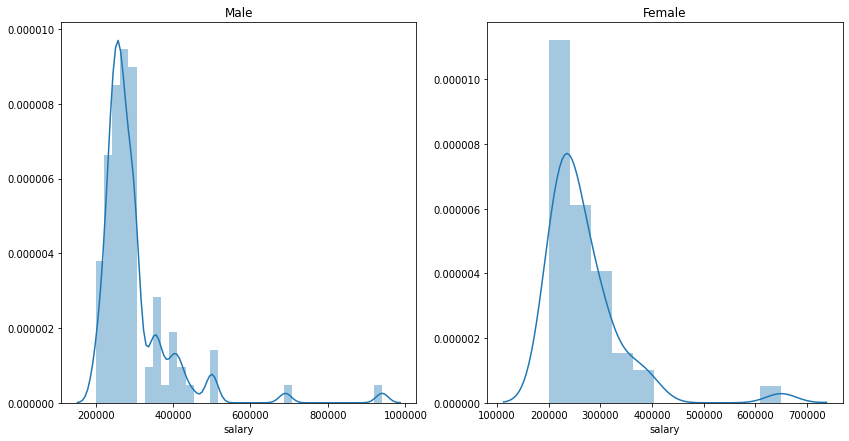
From the image above, we notice that in this dataset, there are more Male observations than Females. Also to find interesting, Women in this dataset were found to have a higher: 2nd Education Percentage, Higher 2nd Education, Degree Percentage, and Master Percentage then men. But Men had higher, employability test and the salary they receieve are higher than the women. From doing outside research and prior knowledge, I’ve heard about the gender wage gap. The wage gap is the average difference between the payment for men and women who are working. Women are generally considered to be paid less than men.
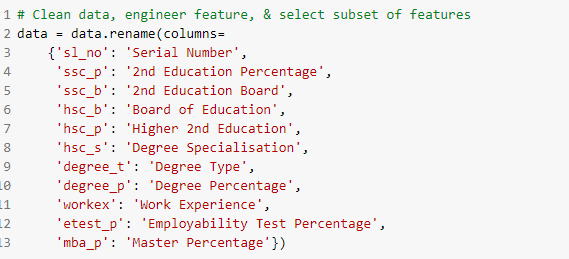
I started off playing with the data. I wanted to do some feature engineering so I renamed most of the columns to get a better understanding of the data and then I wanted to see the correlation between salary and the other columns.
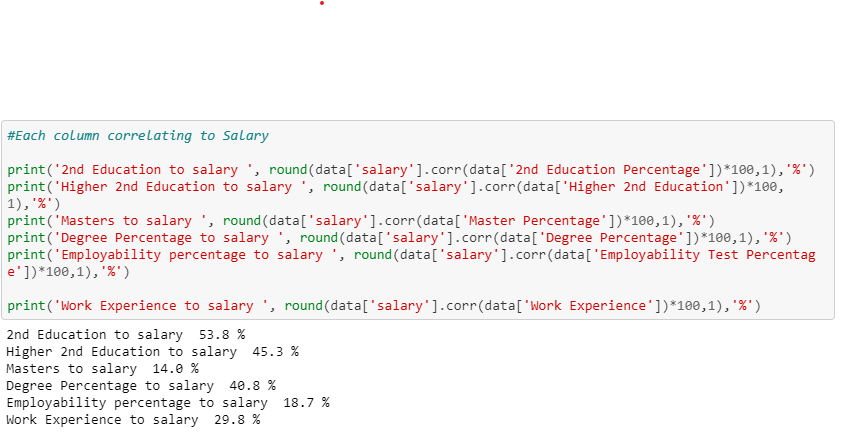
The correlations are showing how much your salary can increase by. Based on the results above, if you have a 2nd education (high school) your salary can jump up 53.8%. If you have graduated and are going back for your masters, you can earn an additional 14%. Based on experience, you might see your wage increase when applying for different jobs by maybe 30%. Seeing these numbers rise definetly shows how important education is to your salary. Without an education, it is very hard to make good money unless you have a concrete plan that has helped you.
Problem
So, which factors influence a student in getting placed landing a job? What can help determine the type of degree you’d like to get? Is there a relationship between 2nd education and your mba percentage? I’d like to find out by running some tests.
First I want to look at this heatmap correlation.
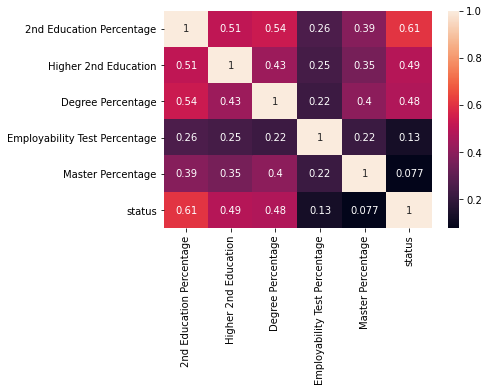
The strongest correlation I found happened to be at .61 which is 2nd Education percentage and your status if you’re getting a job or not. Maybe you can interpret this as, the percentages you got in high school can dictate your success on landing a job.
Core Data
While working on my code, I ran a permutation importance graph. The degree you would like to Specialise in will help increase your knowledge on the degree type you’d want to get. Specialization happens after you complete your undergrad. The MBA percentage tells you the student’s grade during their mba.
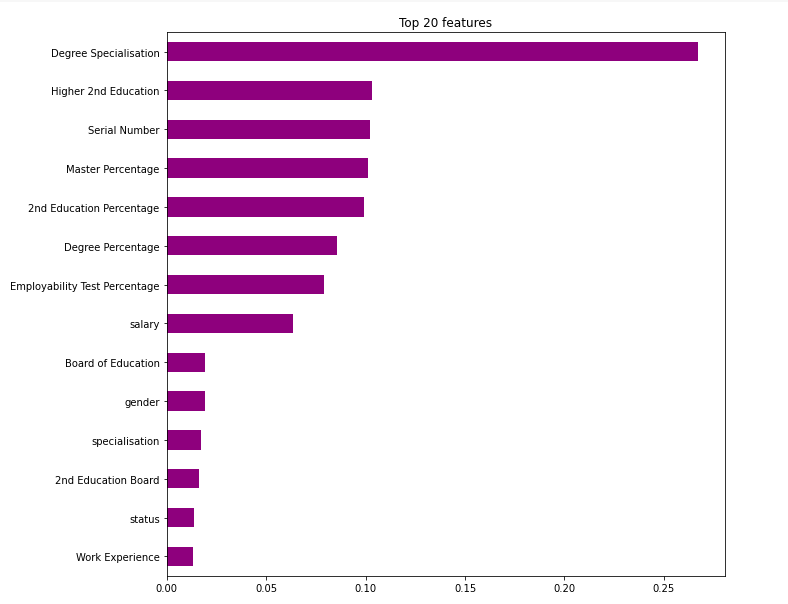
We can see that higher 2nd education & MBA can factor the degree type as well. Not surprised that your regular degree percentage would matter less than your MBA percentage. Since, some people don’t continue on with school.
Next, I wanted to explain the predicition of the linear classification by using an eli5 graph. From here, we notice that degree specialisation is still on top.
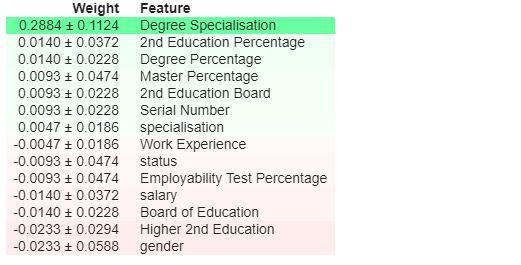
Here we notice a few changes though. The features that can influence your degree type are: 2nd Education percentage, degree percentage, mba percentage, 2nd education board, your serial number, and the specialisation of the degree.
Next, I wanted to compare the students 2nd education percentage(HS Grade 10) with their MBA percentage. I used a Partial Dependance Plot to show.
From the graph shown, it seems that the high school cirriculum has a better grade percentage than the a MBA cirriculum percentage based on the student grades.
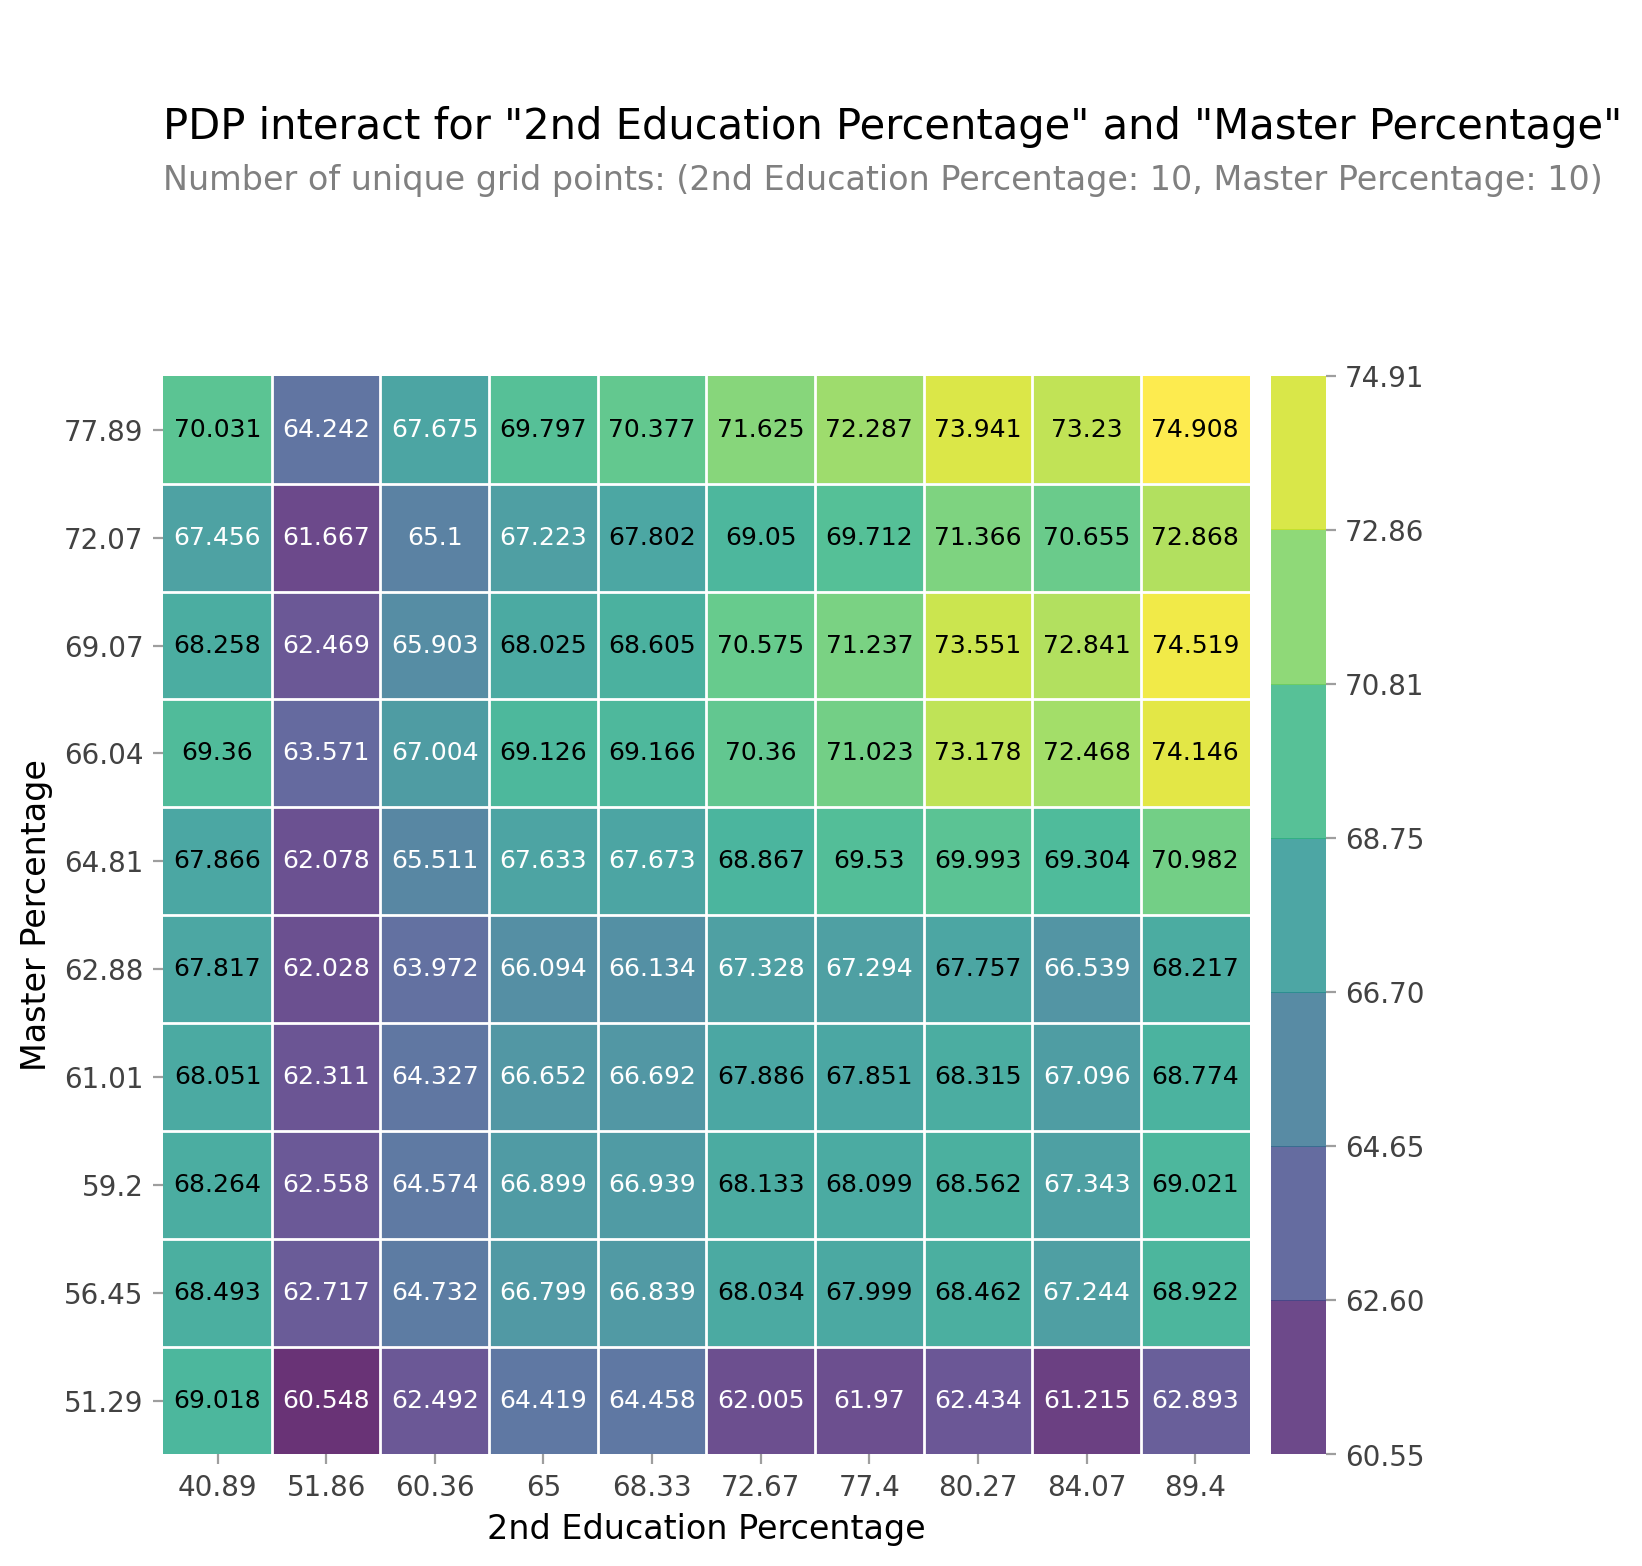
I wanted to look at another Partial Dependence Plot to see if ‘2nd Education’ & ‘MBA’ have high concentration percentages.
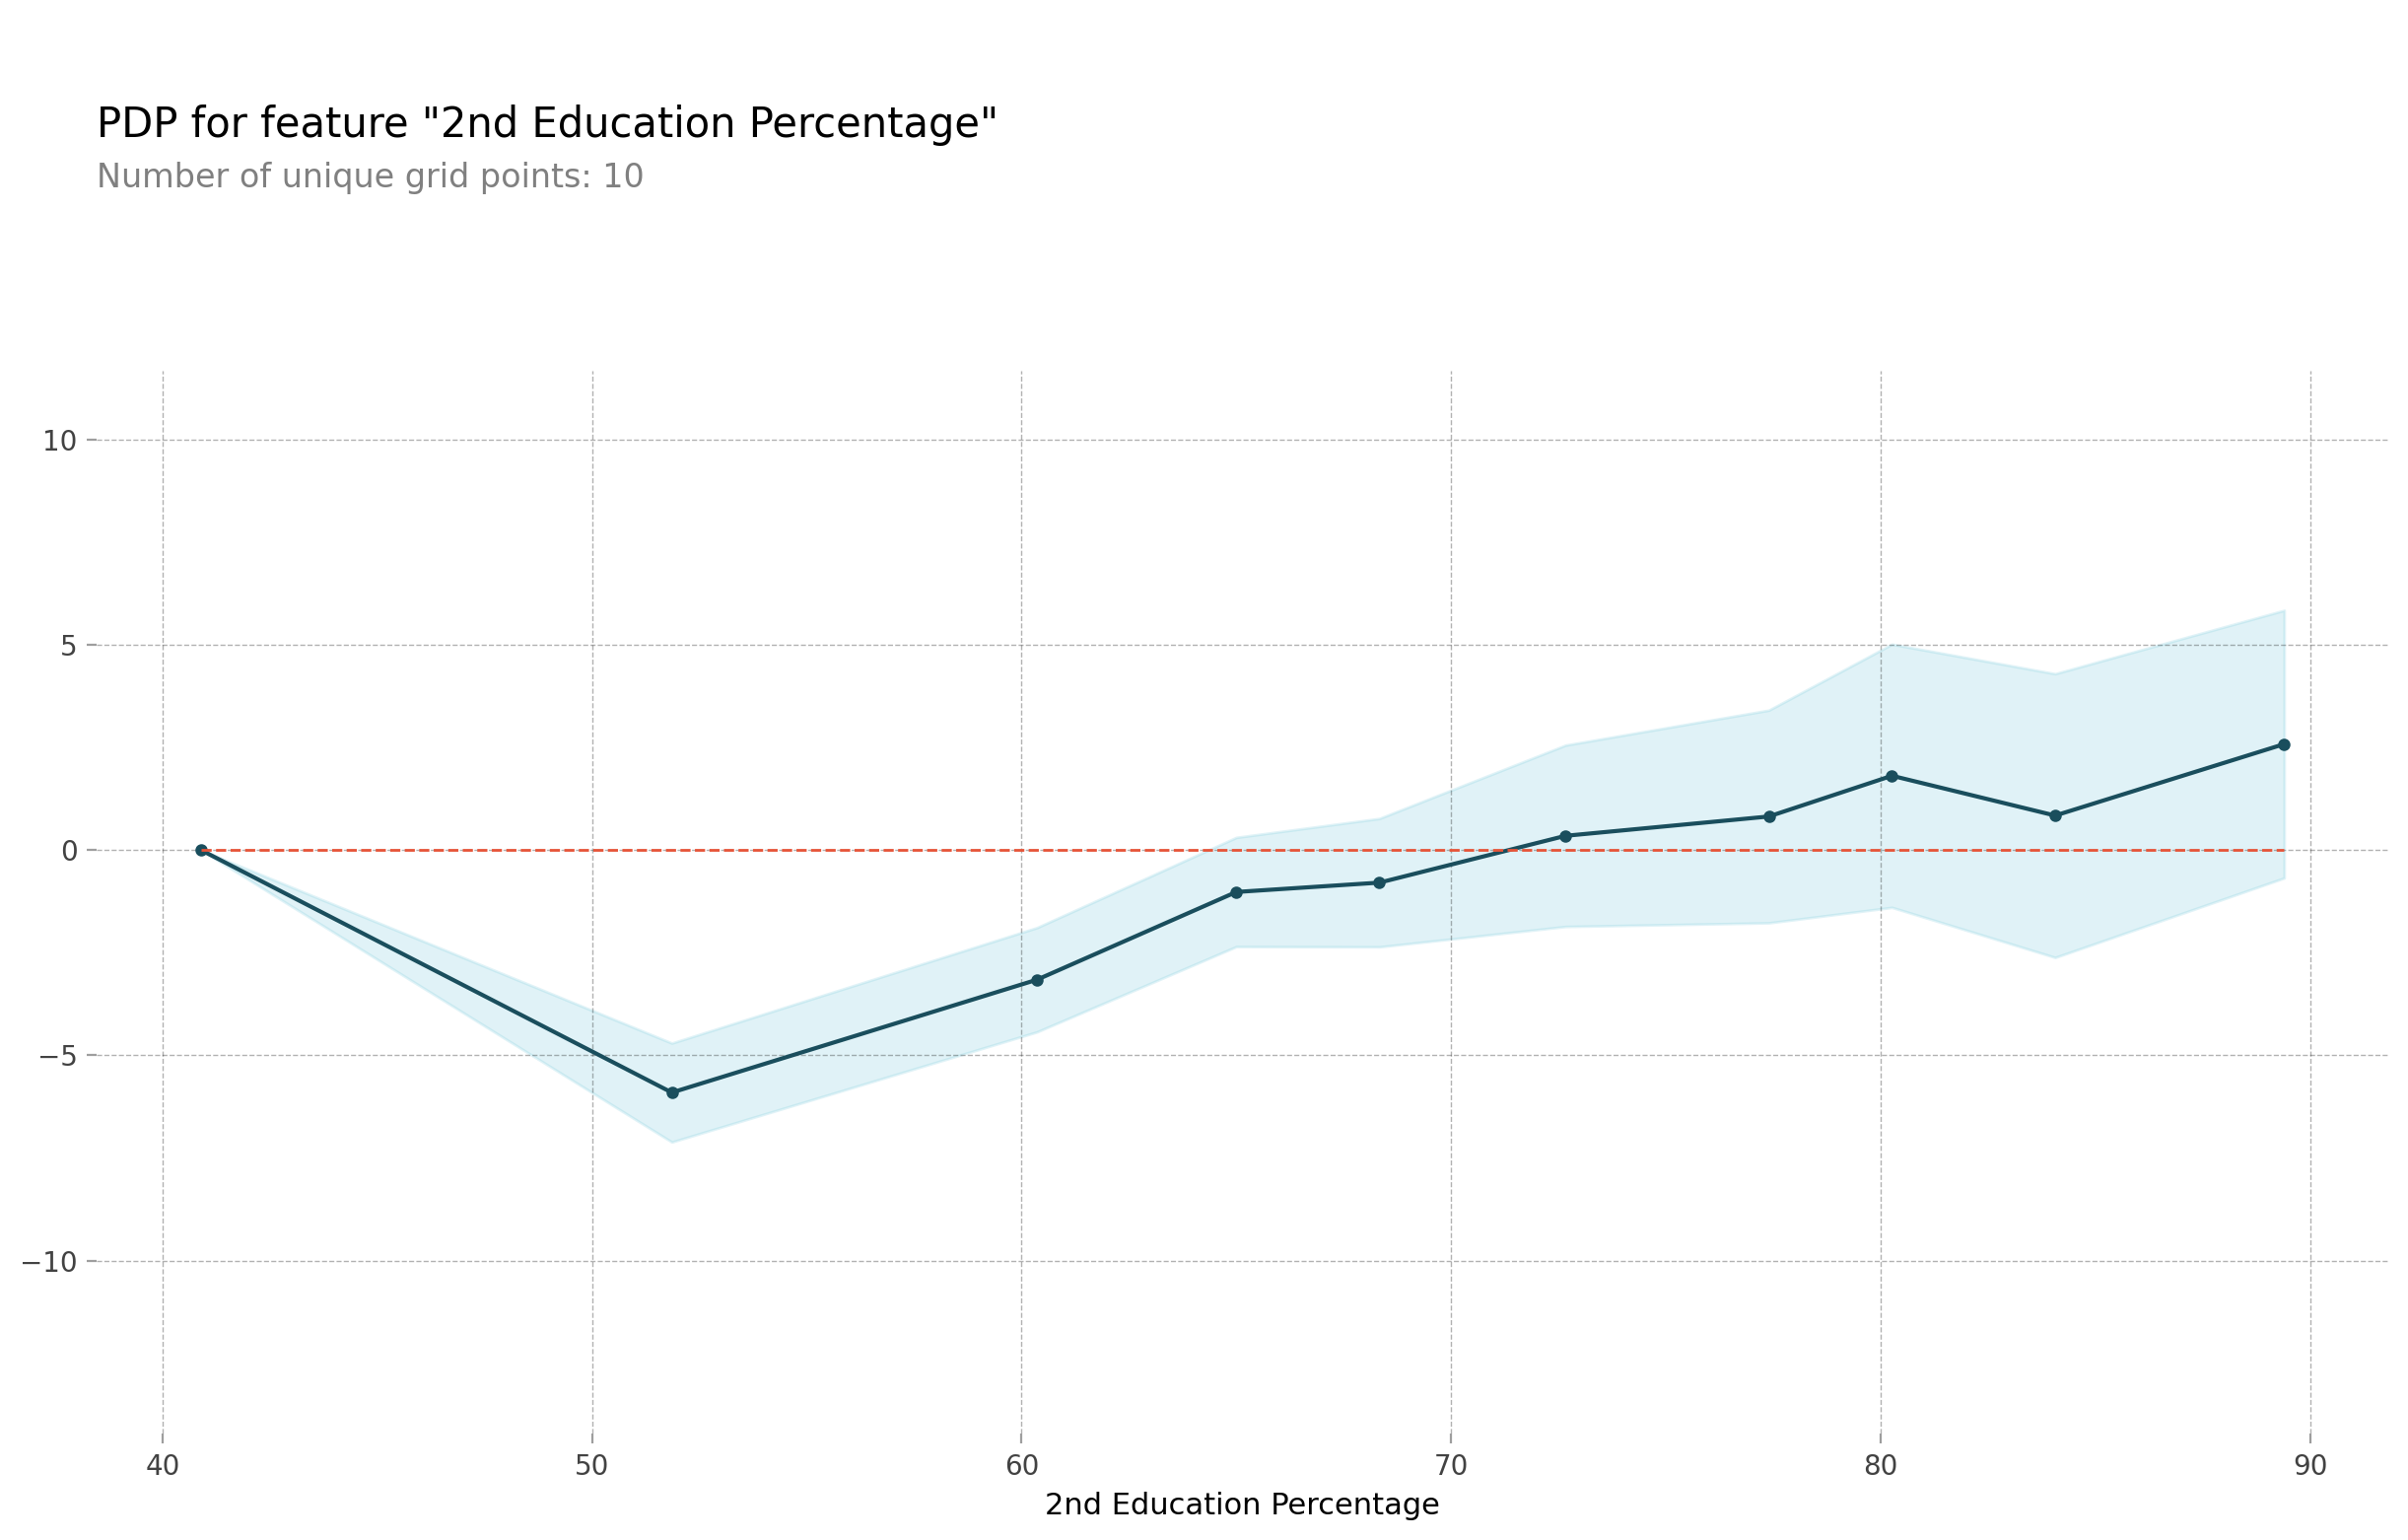
With the 2nd Education, there was an immediate spike downards with a low concentration. It then begins to surprass 0 at around 70% which is about the mean of the students grades at High School.
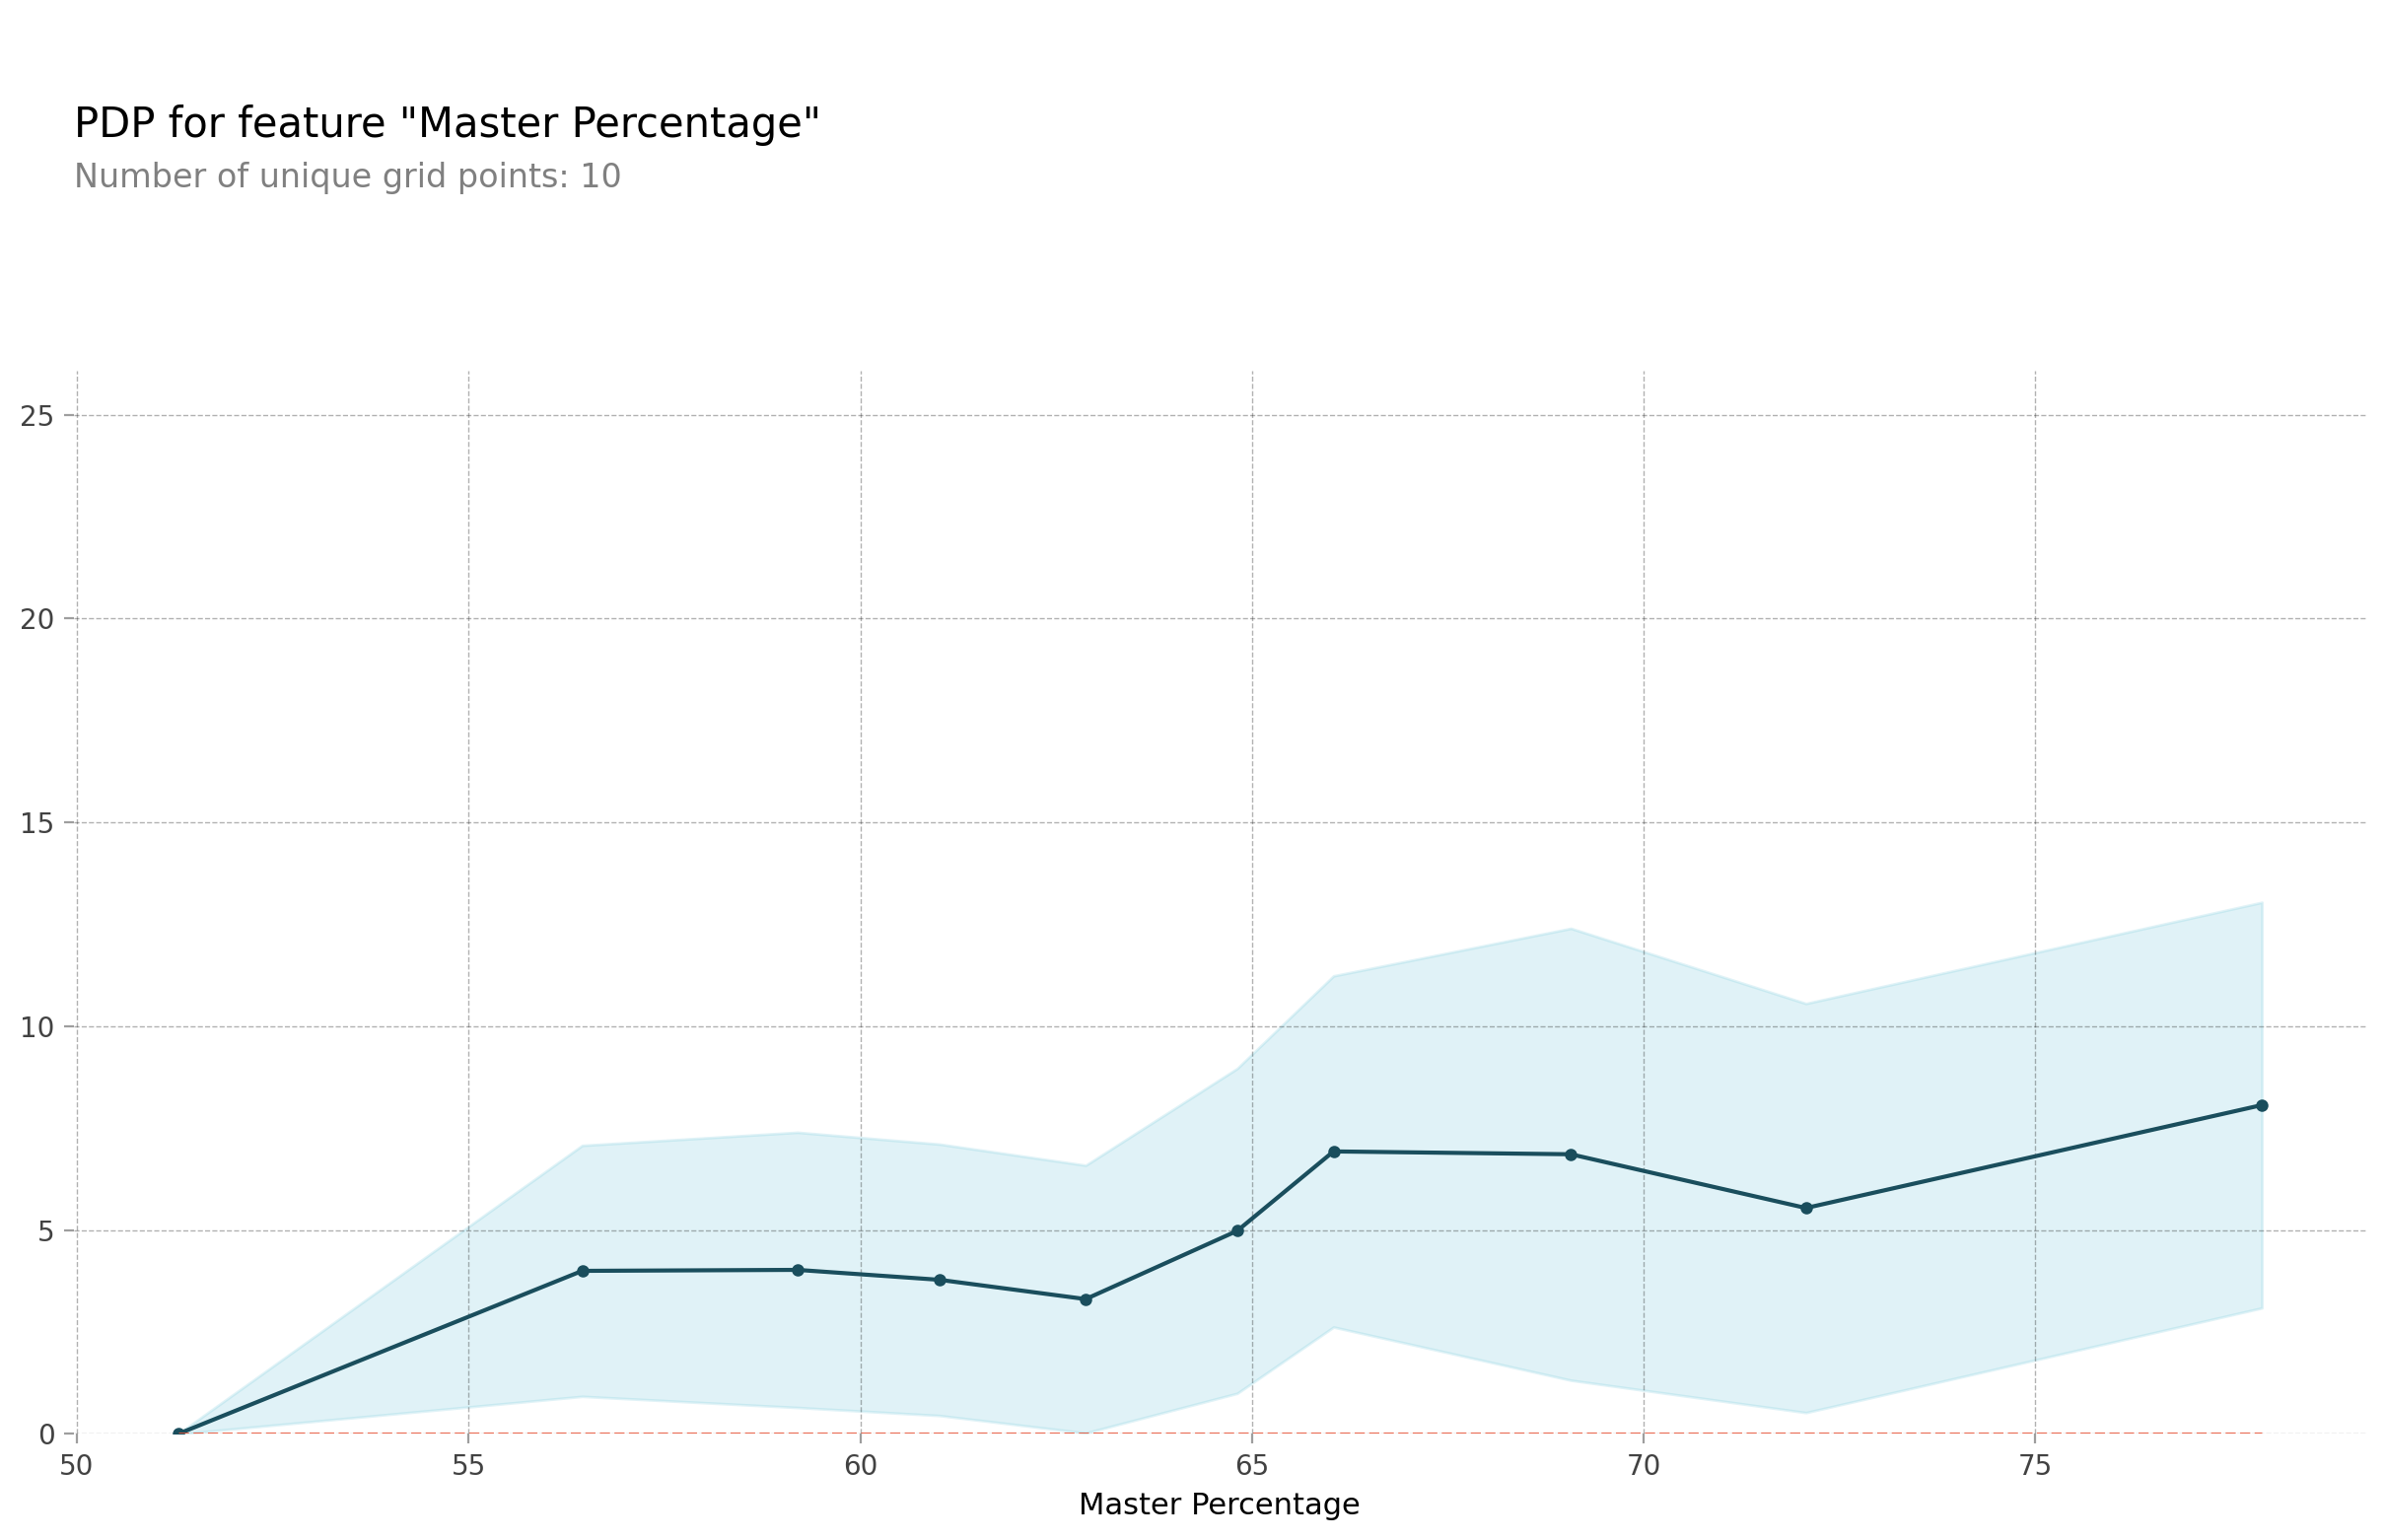
With the MBA, there was an immediate spike and it was positive. MBA also has a low concentration and rises from 50 to 55 %.
Conclusion
From what I’ve seen throughout my research on this project is, your status whether you will likely get a job or not is all based on your perfomance in school. Majority of the people who were placed to have a job had a grade percentage of 70% and better in all categories. When it gets to masters, majority of the placed had a grade percentage of 65% and better. Your degree type depends on the degree you want to specialize in and the percentages you get in class dictates how much your salary will increase by when you complete your MBA. The better your employability test percentage is, the better your salary will increase too.